New dashboard tracks every fatal crash in Maryland
By John Domen
It happened, on average, more than once a day last year. In fact, preliminary data shows that for the second year in a row, exactly 563 people died on Maryland roads in 2022.
The new numbers were released Wednesday by the state of Maryland. In 2022, 135 pedestrians died on state roads, up by four from 2021. Another 11 bicyclists were killed, up five from 2021.
The four “persistent” causes of death, according to state leaders, were speeding and aggressive driving, drug and alcohol impairment, distracted driving, and the failure to use seat belts. And they’re happening at similar rates as in 2020, when those numbers all spiked up.
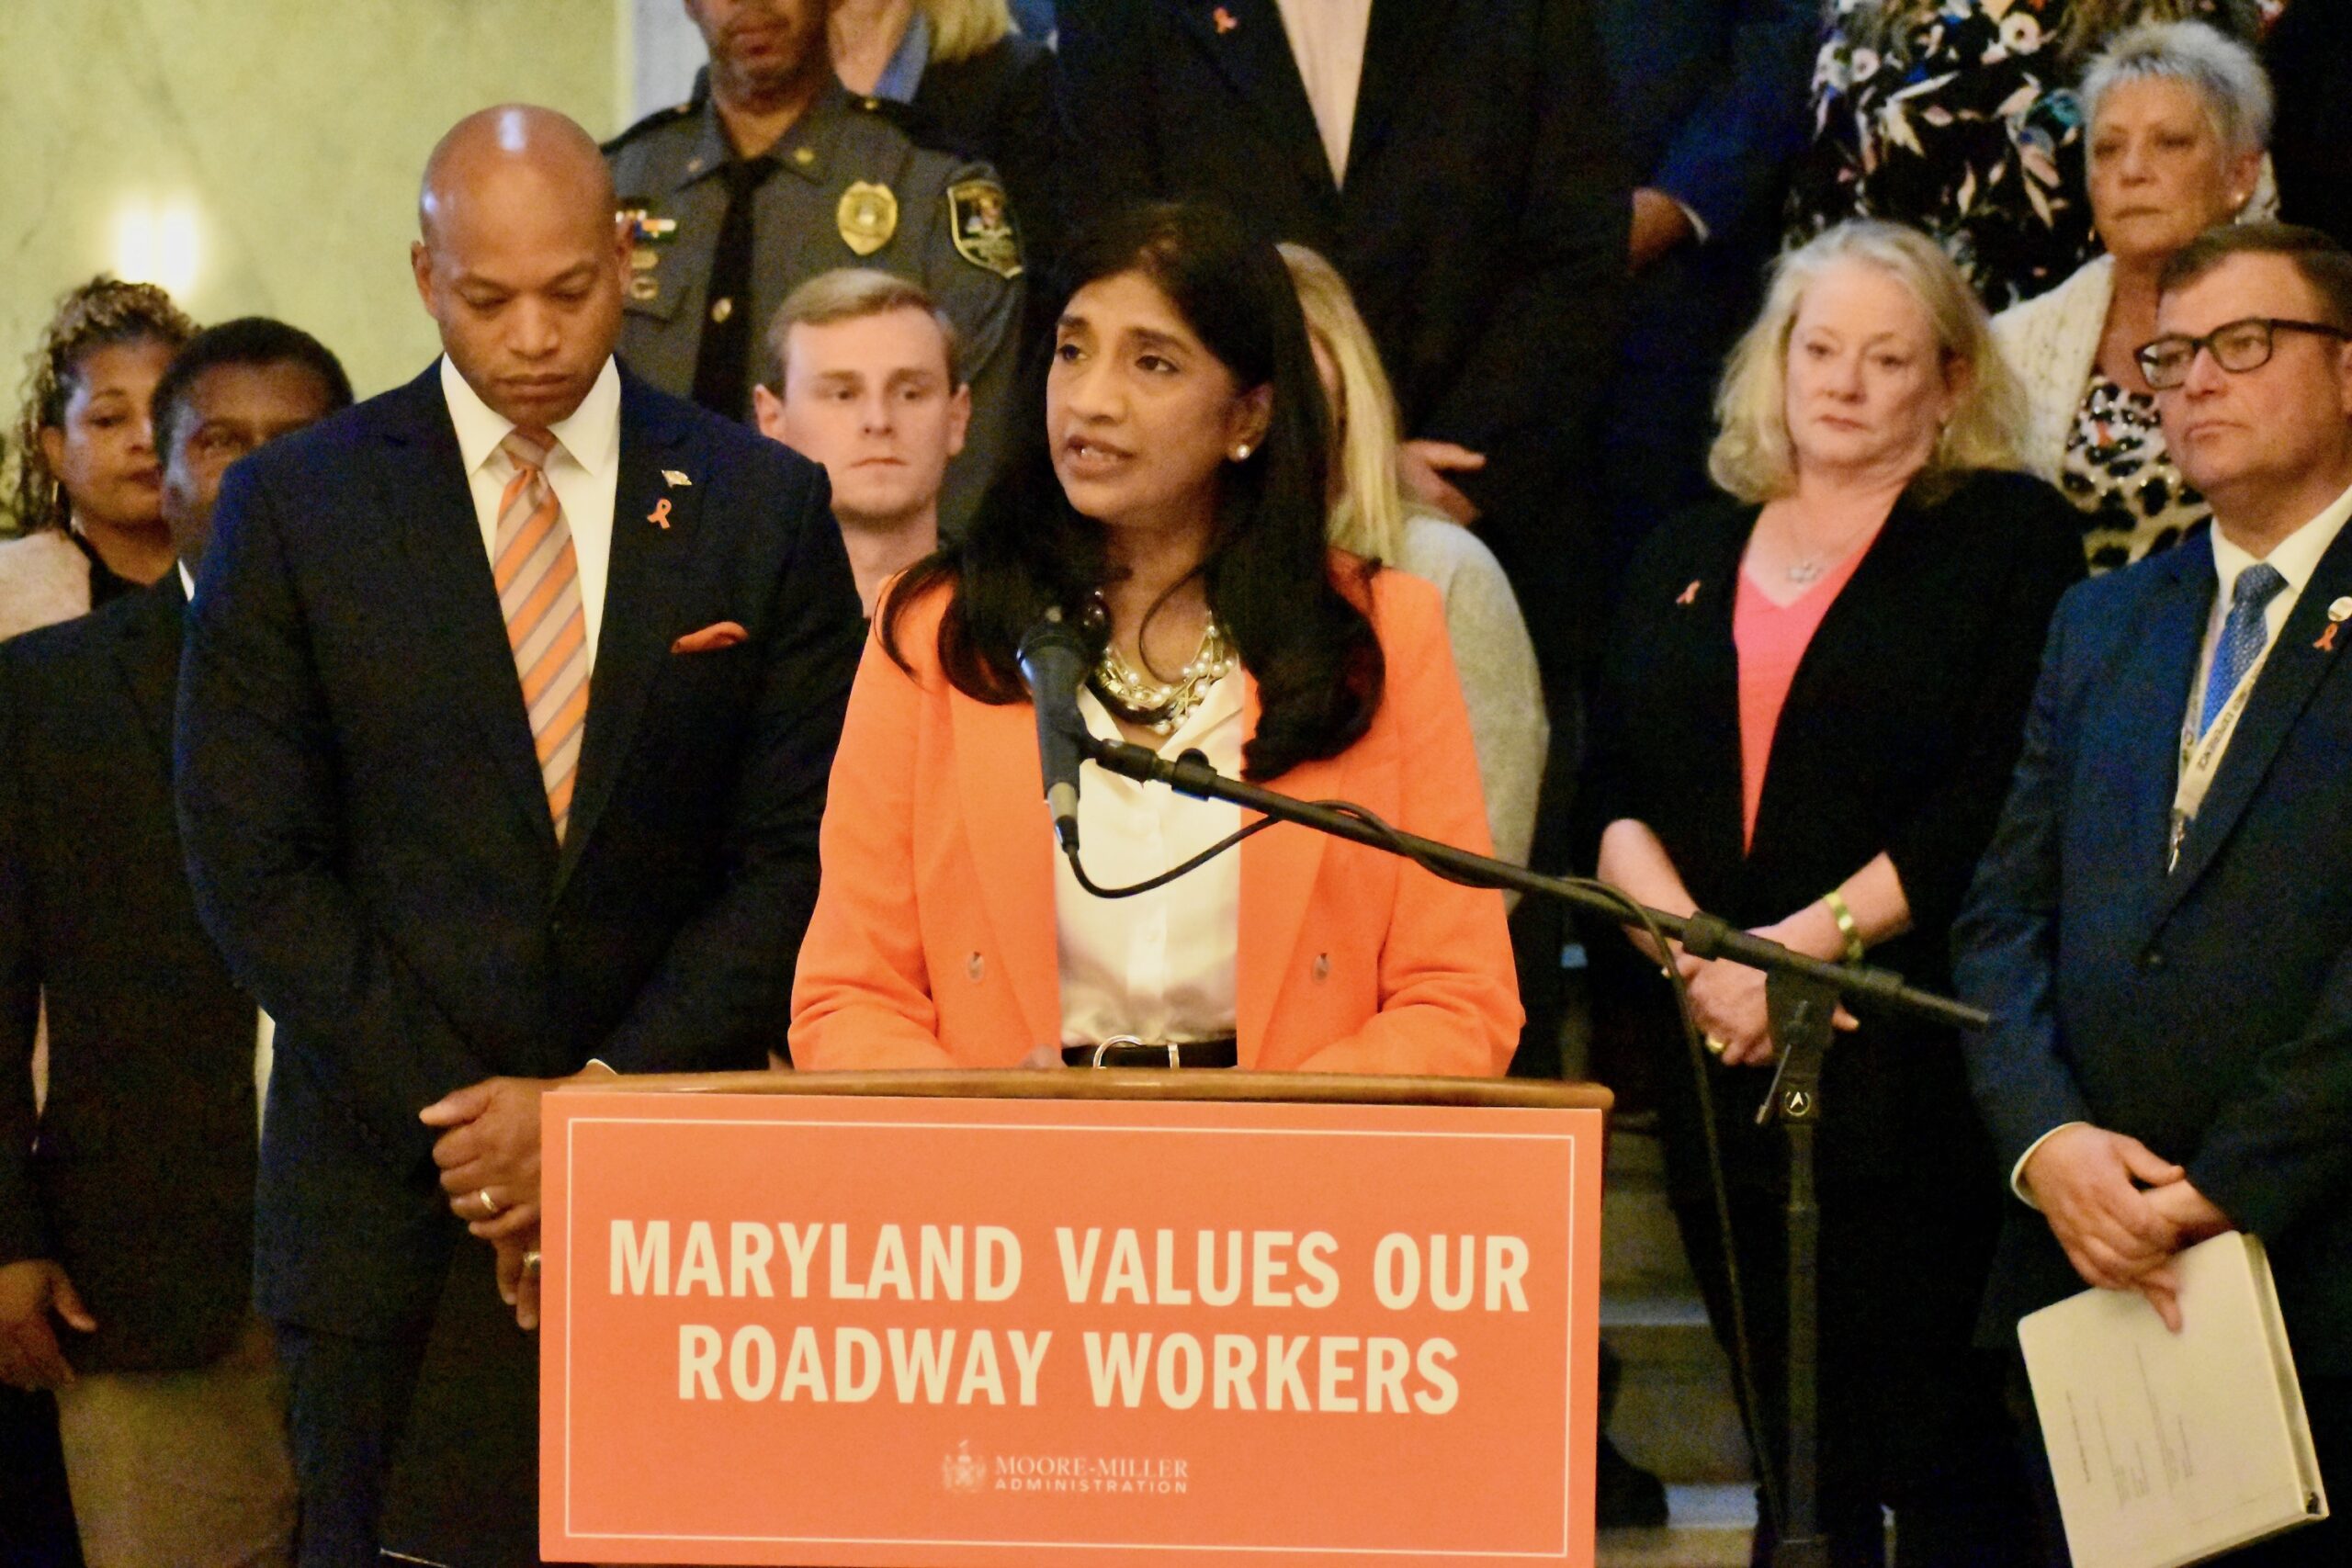
“Unfortunately, during the pandemic, speeds were up on the roadways, there were less cars, and so the cars that were out there were driving faster,” said Chrissy Nizer, the head of Maryland’s Motor Vehicle Administration. “Now the traffic is starting to return to a more normal pattern and people are still driving too fast.”
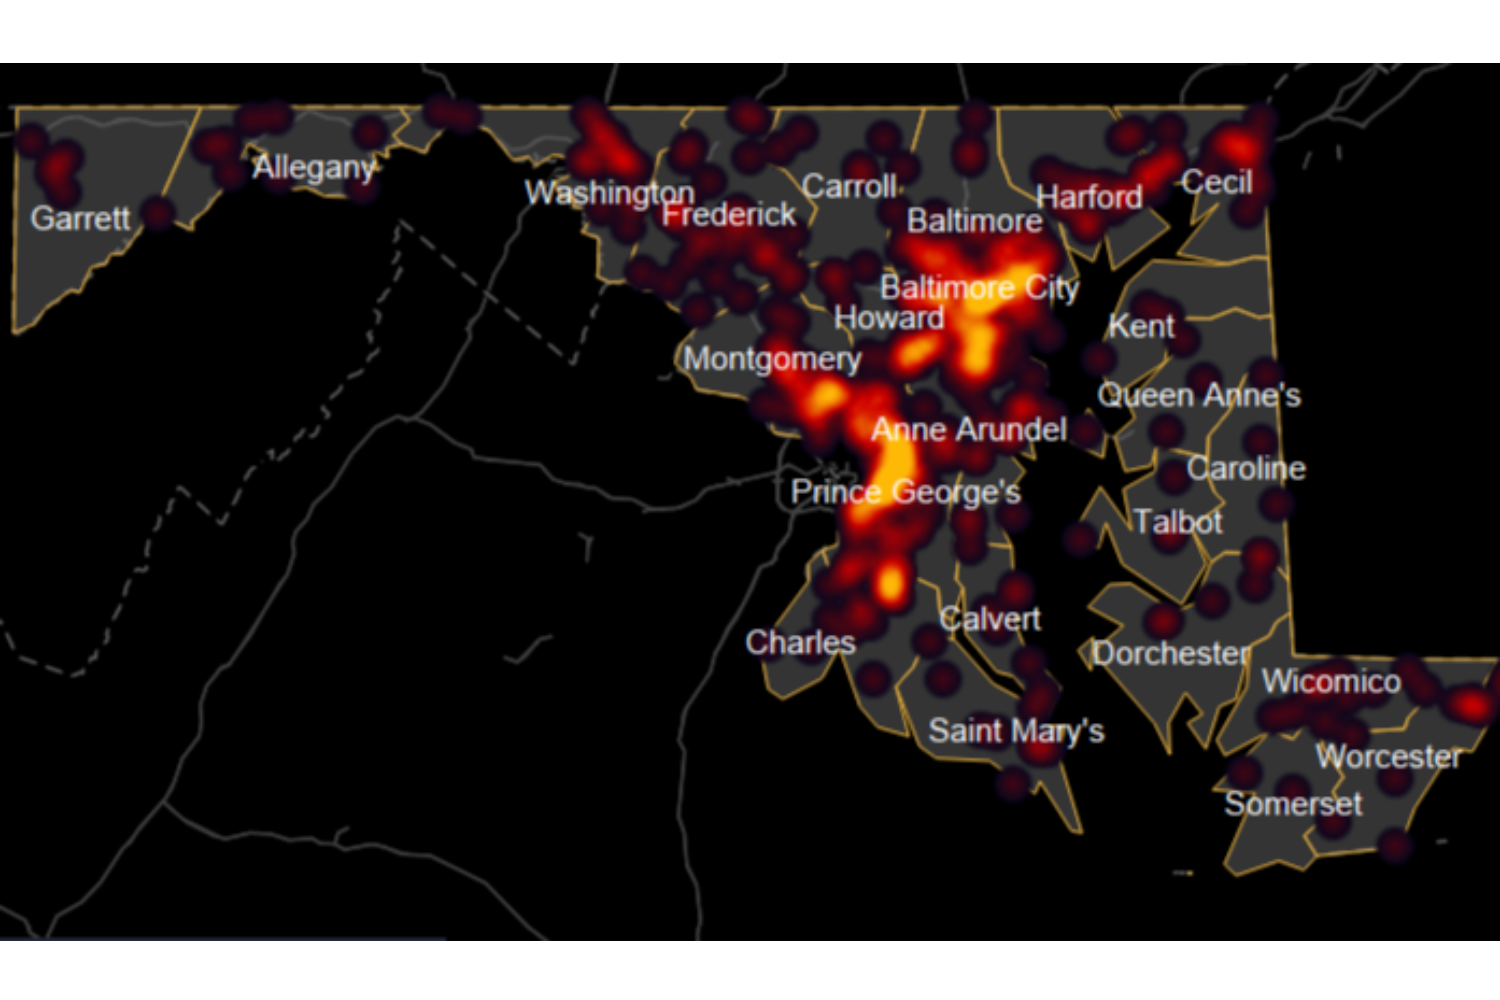
A heat map on the state’s new Crash Fatality Dashboard shows most of the deadly crashes happened in a belt that runs from southern Prince George’s County parallel to the Interstate 95 corridor into northeast Baltimore County.
In fact, broken down by jurisdiction, Prince George’s County was the deadliest county to drive in, with 99 lives lost on the road. Baltimore County was second with 63 fatalities. Montgomery County was third with 44.
“There’s more density and that’s where we tend to see more crashes,” said Nizer.
The number of young drivers — defined as between 15 and 20 — who died last year was 28, which is also an increase from 2021. Crashes involving mature drivers — defined as those over 65 — shot up in 2022, from 35 to 54.
In her remarks, Nizer said she purposely used the term “crashes” instead of “accidents” to describe these deaths.
“That’s because the causes that we’ve just talked about are a decision that someone either made before they got behind the wheel … or got made when they were behind the wheel,” said Nizer. Citing examples, such as impaired or aggressive driving, “they’re not accidents. They’re a decision somebody made that led to somebody either seriously being injured or losing their life.”
She also stressed that behind all the numbers are real people.
“They’re families who are changed forever, who will never be the same again,” Nizer said.
It’s worth keeping in mind that these are just preliminary numbers, and are still subject to revision. In years past, this information wasn’t usually released by Maryland until much later in the year.
Maryland Matters is a proud partner with WTOP News, which delivers the latest local news, traffic and weather information to the Washington, D.C., region. Click here for the WTOP News website.
Related Articles
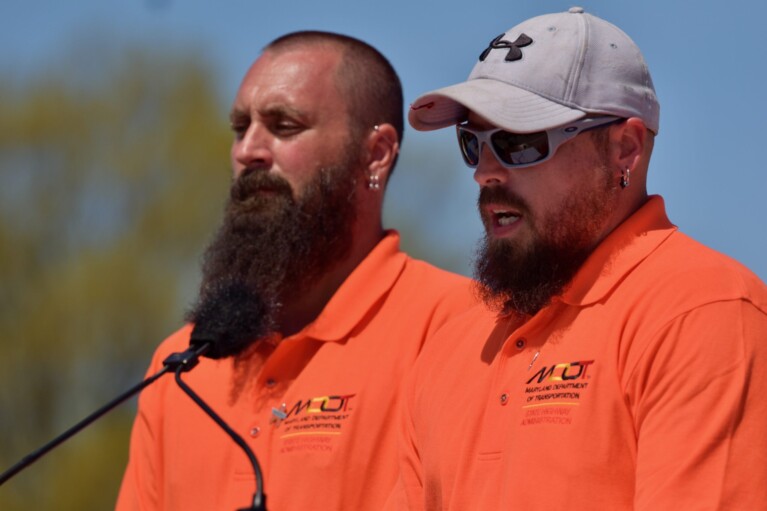
Thirty seconds could have changed the fate of Robert Lewis and his road maintenance crew. Lewis and his coworkers had just arrived at a…
Maryland could collect tens of millions from speed camera citations under proposed law.
A highway work zone safety task force calls for increased fines, enforcement, public awareness campaigns and a mascot in an effort to reduce deaths.
 Creative Commons Attribution