Montgomery County Will Map Urban Heat Islands and Heat Inequities This Summer
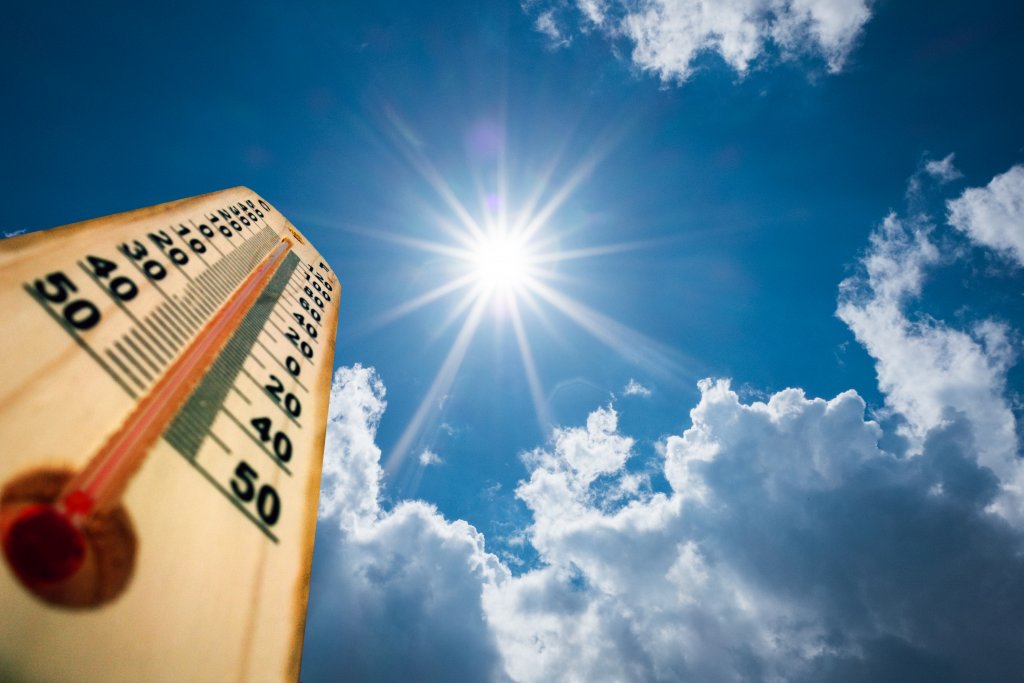
What’s the hottest summertime spot in Montgomery County?
A group of citizen scientists will soon find out.
Montgomery County is undertaking a project to map out various temperatures of its neighborhoods as a part of a national effort to keep track of heat inequities and find solutions for the county’s urban heat islands.
With the help of the National Oceanic and Atmospheric Administration, local scientists and a handful of volunteers, the county plans to measure the temperature and humidity of most of its urbanized areas, including Montgomery Village, Germantown, Rockville, Bethesda and Aspen Hill.
Click here to read more from our Climate Calling series.
Montgomery County is one of 16 jurisdictions the National Oceanic Atmospheric Administration is collaborating with this summer to help determine “urban heat islands,” or the phenomenon that urban areas tend to have higher temperatures because they have more buildings and roads, which absorb sunlight’s heat more than natural landscapes like forests and farmland. A neighborhood can be up to 20 degrees hotter than a nearby area, according to National Oceanic Atmospheric Administration.
“Extreme heat kills more Americans than any other weather event,” said Laura Sivels, the program manager of climate engagement for Montgomery County Department of Environmental Protection. “It’s really important that we can identify where these are so we can reduce these heat inequities and provide protection for vulnerable neighborhoods,” which disproportionately include low-income communities and communities of color, she continued.
In 2018, the National Oceanic Atmospheric Administration and local volunteers did a similar project in Baltimore and found that some neighborhoods recorded temperatures 16 degrees higher — at 103 — than the coolest parts of the city at the same time on an afternoon summer day in August. The highest temperatures were in the Penn Fallsway, Middle East and Milton-Montford neighborhoods.
Montgomery County selected specific neighborhoods to monitor by using environmental justice screening, tree canopy cover and the “social vulnerability index” that uses U.S. Census data to determine how resilient a community is when confronted by external stresses like natural disasters or disease outbreaks. It was important to not only include vulnerable communities but also wealthy areas to be able to compare neighborhoods, Sivels said.
On one hot and clear sky day some time in early August — a date yet to be determined by local climatologists — a group of volunteers will attach sensors that capture the surrounding temperature and humidity to their cars and drive a pre-planned route for hour intervals in the morning, afternoon and evening. These sensors will offer a more accurate surface temperature than temperature maps derived from satellites.
There will need to be at least 20 cars, with a driver and navigator in each, Sivels said, but the county is accepting a couple of hundred volunteers since a driver or navigator might not be able to do a complete route or volunteer for the whole day.
The county will prioritize volunteers who live or work in neighborhoods that will be mapped, Sivels said. “I think that will help them be more connected to climate resilience solutions,” she said.
Only after a day of opening volunteer registration last week, the county had received around a hundred applications, according to Sivels.
Community members can also mark specific places in the county — such as parking lots, bus stops and schools — they feel the most heat on a live map on the volunteer registration webpage. There is no official deadline for when volunteers can register, but training will most likely begin in July, Sivels said.
The project involves a considerable amount of driving and consequently greenhouse gas emissions, which Sivels noted was something that the county took into consideration. But conversations with climatologists revealed that sensors on cars will achieve the most accurate data, she continued.
Once Montgomery County creates a detailed map of various temperatures of the jurisdiction, the county will reach out to communities facing the most extreme heat and work on climate adaptation strategies with them — such as building public air conditioned spaces, planting more trees for shade and removing black asphalt or dark roof surfaces, which absorb more heat, Sivels said.
To sign up as a volunteer, click here.
Elizabeth Shwe
Reporter
Elizabeth Shwe was a Report for America corps member at Maryland Matters through May 2022. She previously covered California state politics during an internship at The Sacramento Bee. She is a 2020 graduate of Princeton University with a degree in political science. At Princeton she was a producer for WPRB 103.3 FM News & Culture section, the station’s only long form podcast-type program. Shwe also wrote for The Daily Princetonian, and tutored with the Petey Greene Program, which offers free tutoring to incarcerated people.
Related Articles
Funding programs emerge to help Maryland reach its goal of putting 5 million native trees on public and private lands by 2031.
Young conservatives who favor acting to combat climate change may seek guidance from the former governor’s environmental record.
House committee’s decision to amend a popular consumer protection bill puts its fate in doubt as Sine Die approaches.
 Creative Commons Attribution
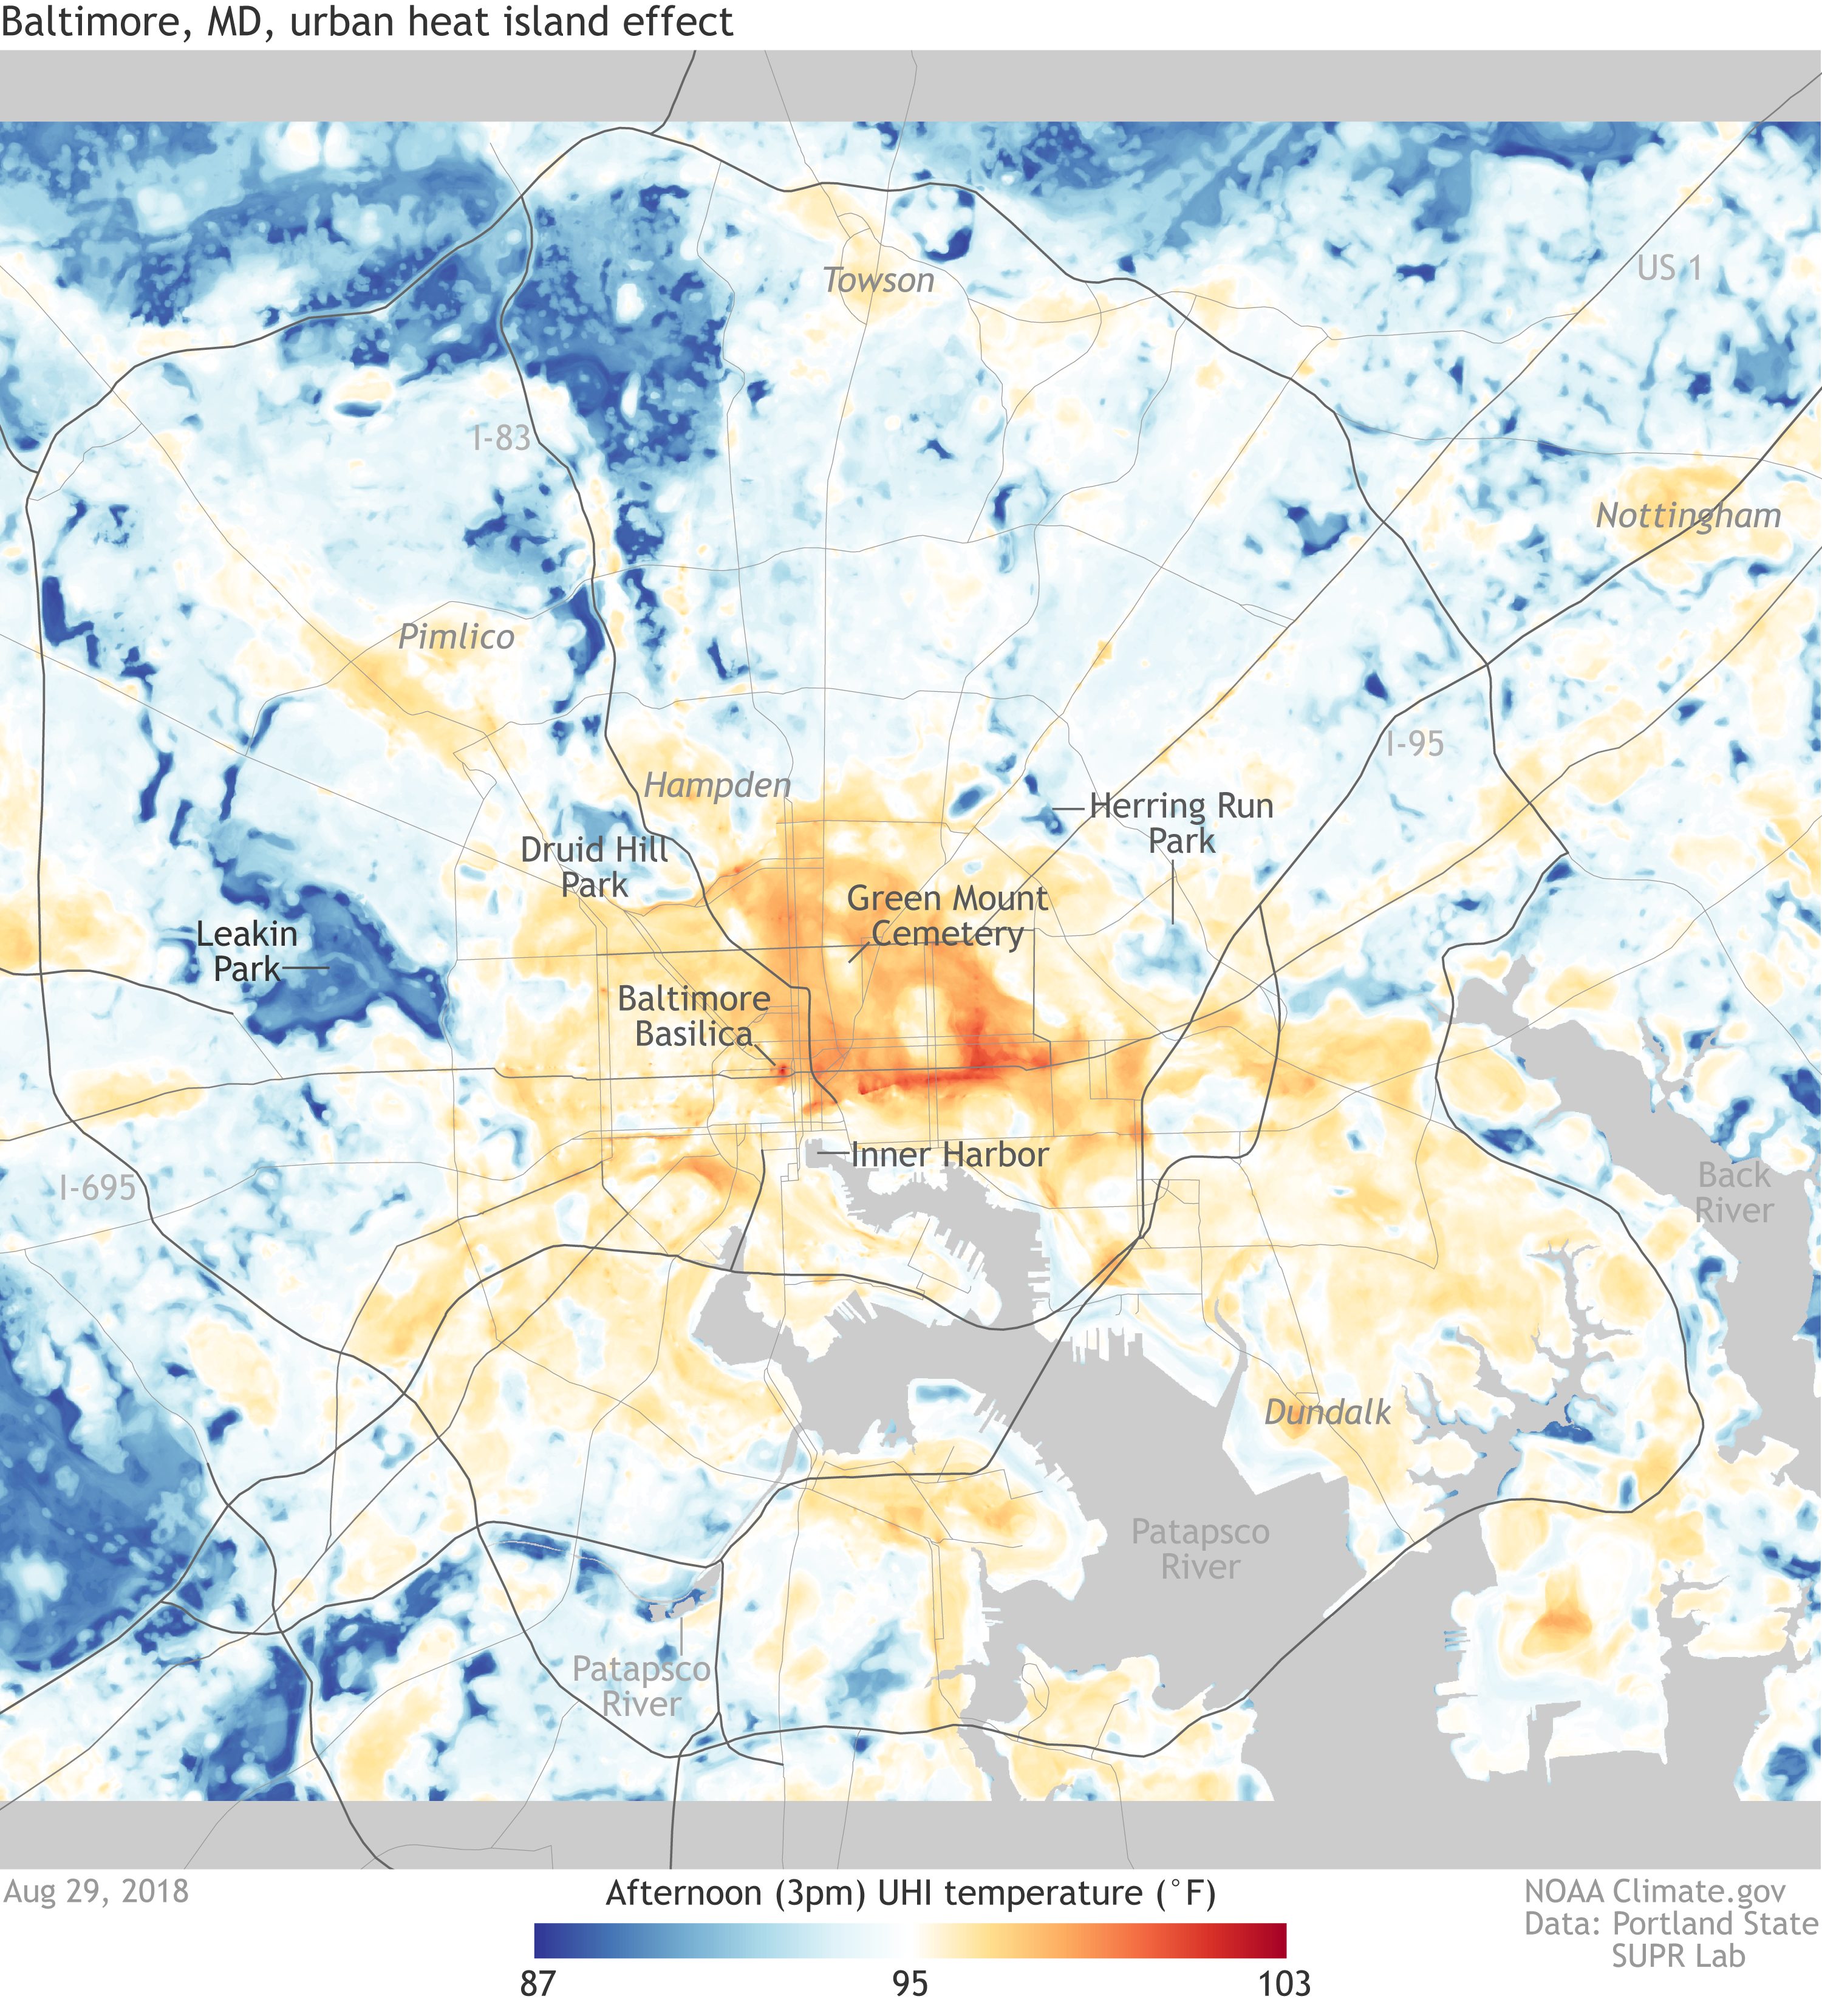