Analysis: Legislature’s Congressional Maps Offer Some Hints. But They Raise Lots of Questions, Too.

The release of four “conceptual” maps by a legislative redistricting commission this week represents a significant milestone in the once-a-decade process of redrawing Maryland’s congressional boundaries.
Although the panel’s chair stressed that the maps are subject to change, the four plans contain numerous similarities. As such, they offer a tentative — but intriguing — glimpse into the final recommendation that the Legislative Redistricting Advisory Commission (LRAC) will forward to the General Assembly.
The LRAC is expected to submit its final design in the next few weeks. It will be up to the legislature to approve a map for use in 2022 and beyond. Lawmakers convene in special session on Dec. 6 to tackle congressional redistricting.
Democrats have the votes they need to do as they wish, despite Republican Gov. Lawrence J. Hogan Jr.’s repeated calls for nonpartisan maps. The commission he created, the Maryland Citizens Redistricting Commission (MCRC), produced a “start from scratch” approach, with compact districts that largely adhere to county and geographic boundaries.
The four “concepts” put forward by the legislative panel, by contrast, appear to use the state’s current — and controversial — map, with 7 Democratic districts and one Republican, as a starting point.
It was hatched in 2011, when Democrats had full control of state government, and it contains many twisty and contorted districts. The Democrats’ approach spawned a court case that made it all the way to the U.S. Supreme Court — though justices ultimately refused to set a standard for what constitutes extreme gerrymandering.
Political reform groups have no such hesitation.
On Thursday, the Princeton Gerrymandering Project gave all four of the LRAC’s maps a failing grade — “F.” The map produced by the Hogan commission earned an “A” grade from this organization. Researchers rated each of the five proposals on “partisan fairness,” “competitiveness” and “geographic features.”
The Princeton analysts have issued grades of “F” to numerous states, including GOP strongholds Texas and Wisconsin, and Oregon, where Democrats have control of the redistricting process. The MCRC map, endorsed by Hogan and blessed by the Princeton Gerrymandering Project, would likely produce six Democratic seats and two Republican.
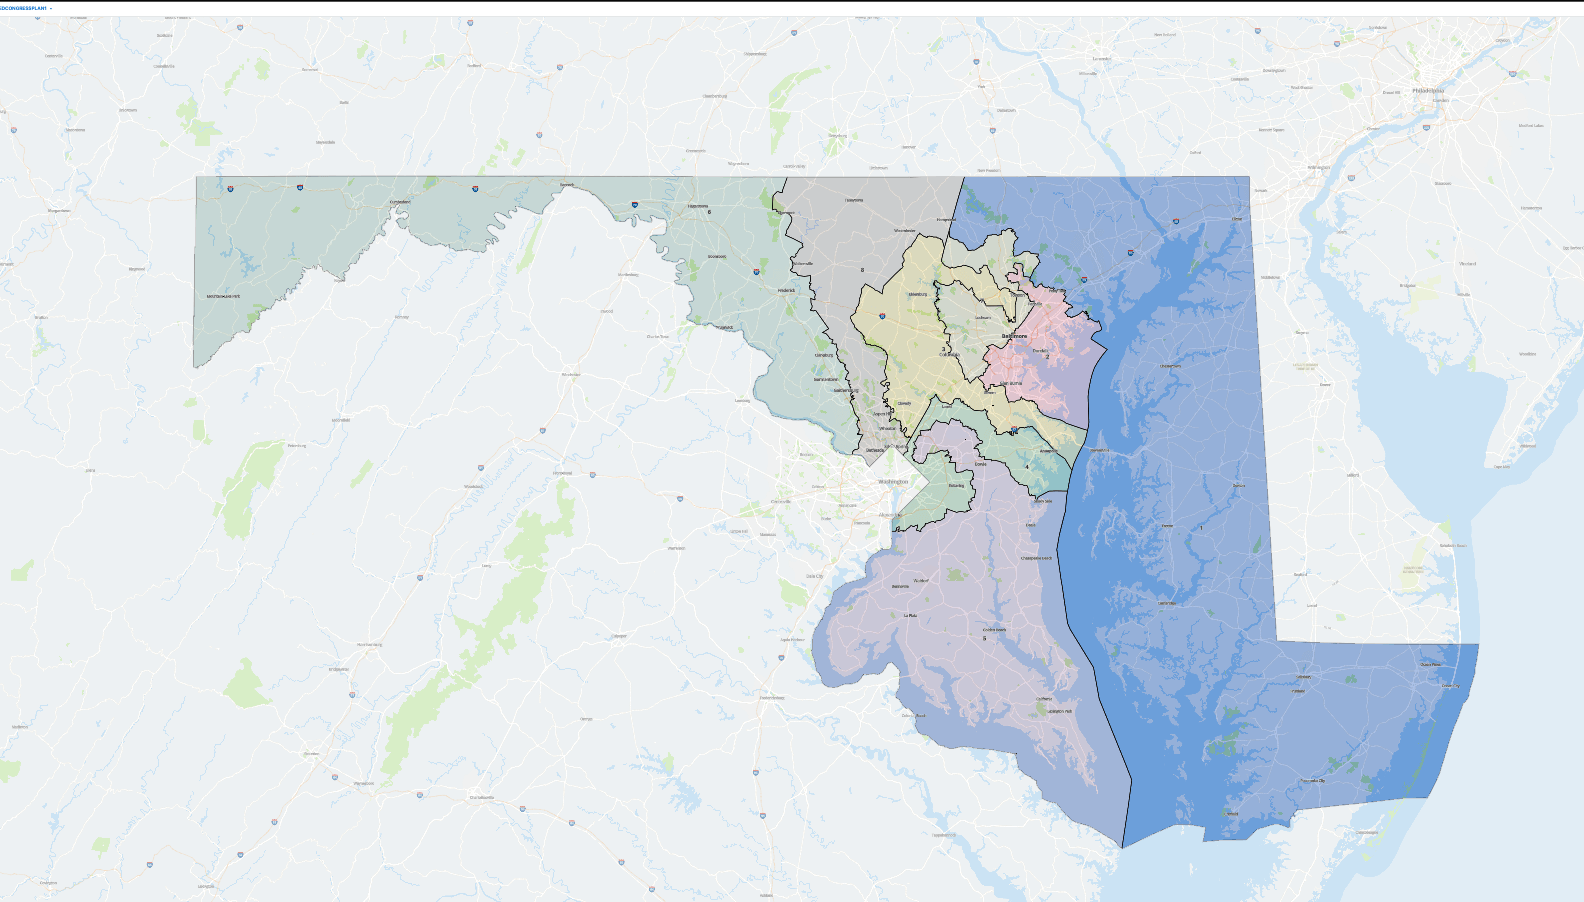
The first of four congressional concept maps released by the Legislative Redistricting Advisory Commission Tuesday, Nov. 9.
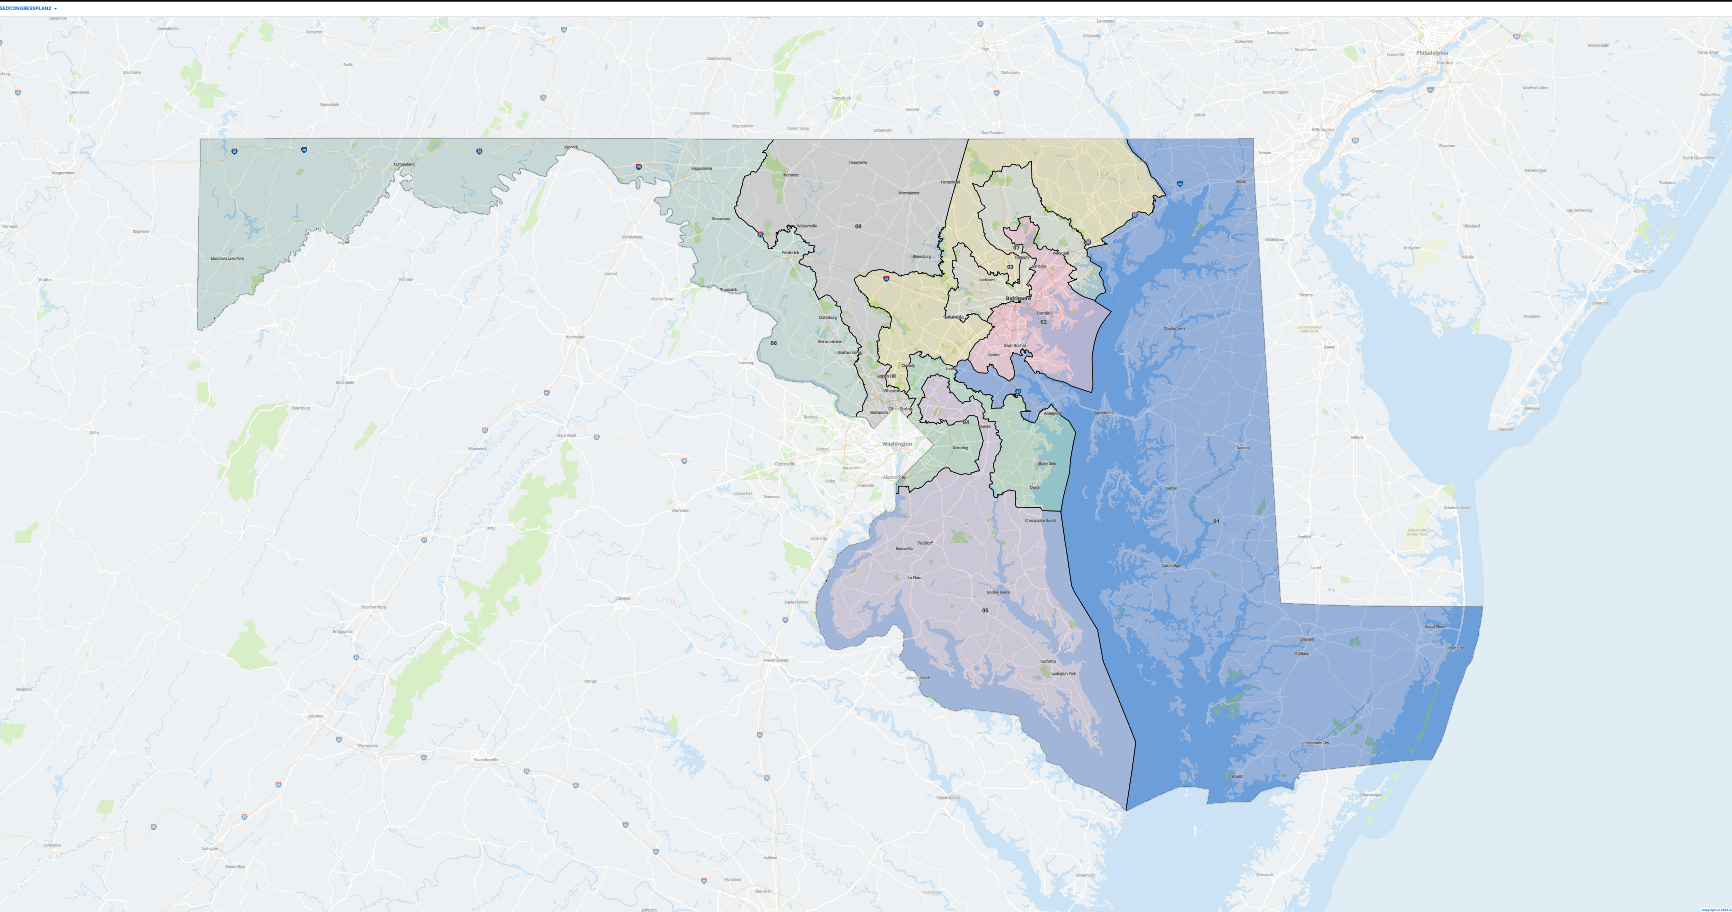
The second of four congressional concept maps released by the Legislative Redistricting Advisory Commission on Tuesday, Nov. 9.
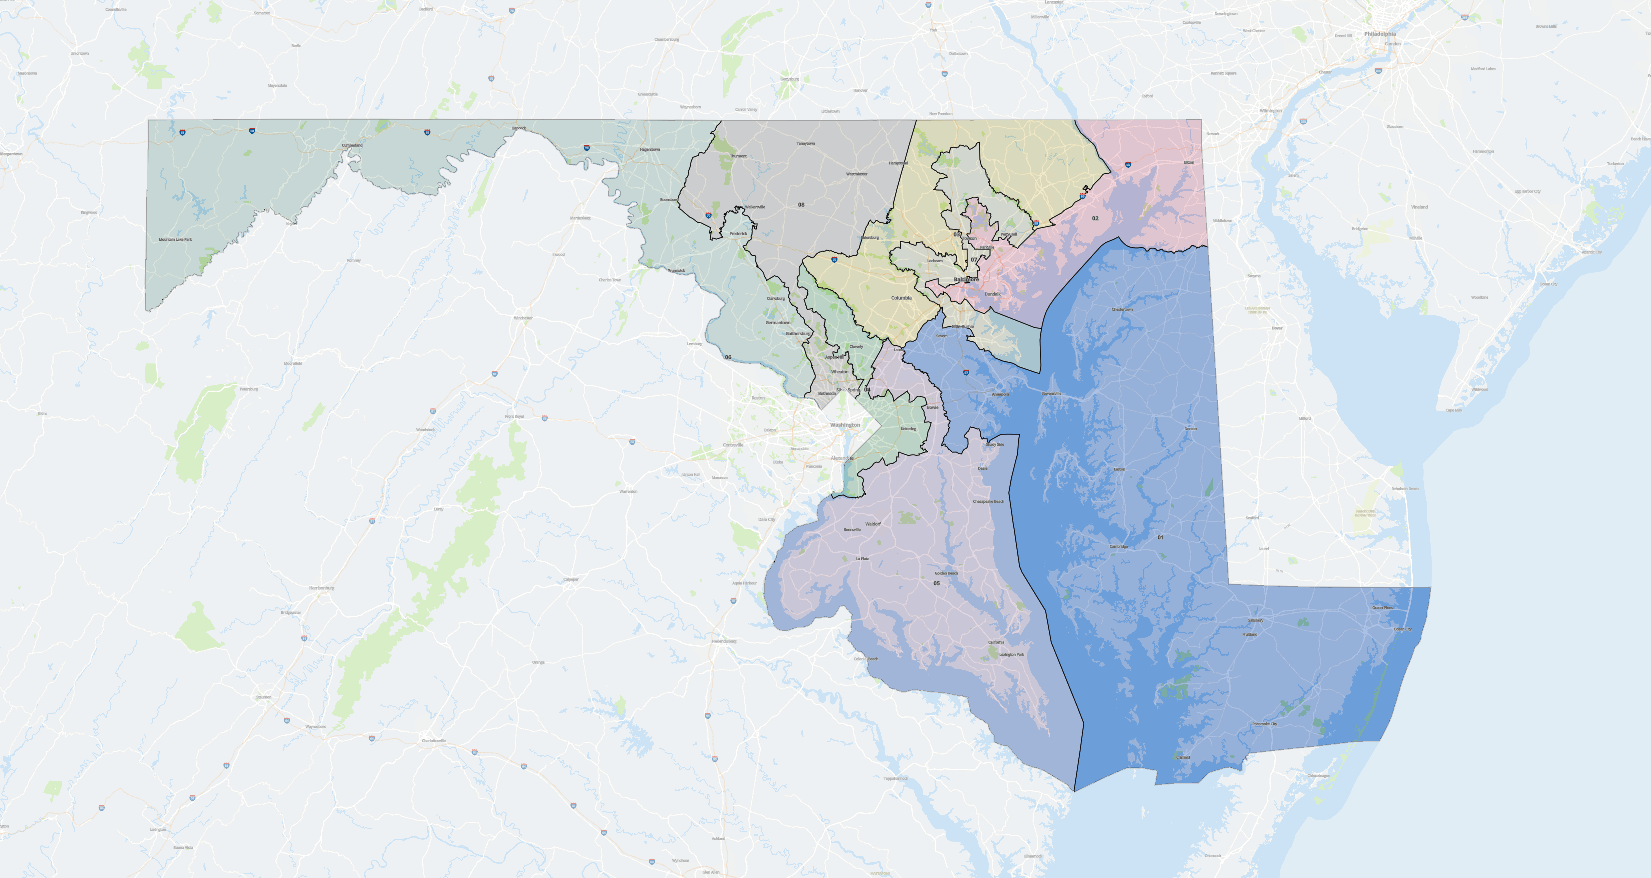
The third of four congressional concept maps released by the Legislative Redistricting Advisory Commission on Tuesday, Nov. 9.
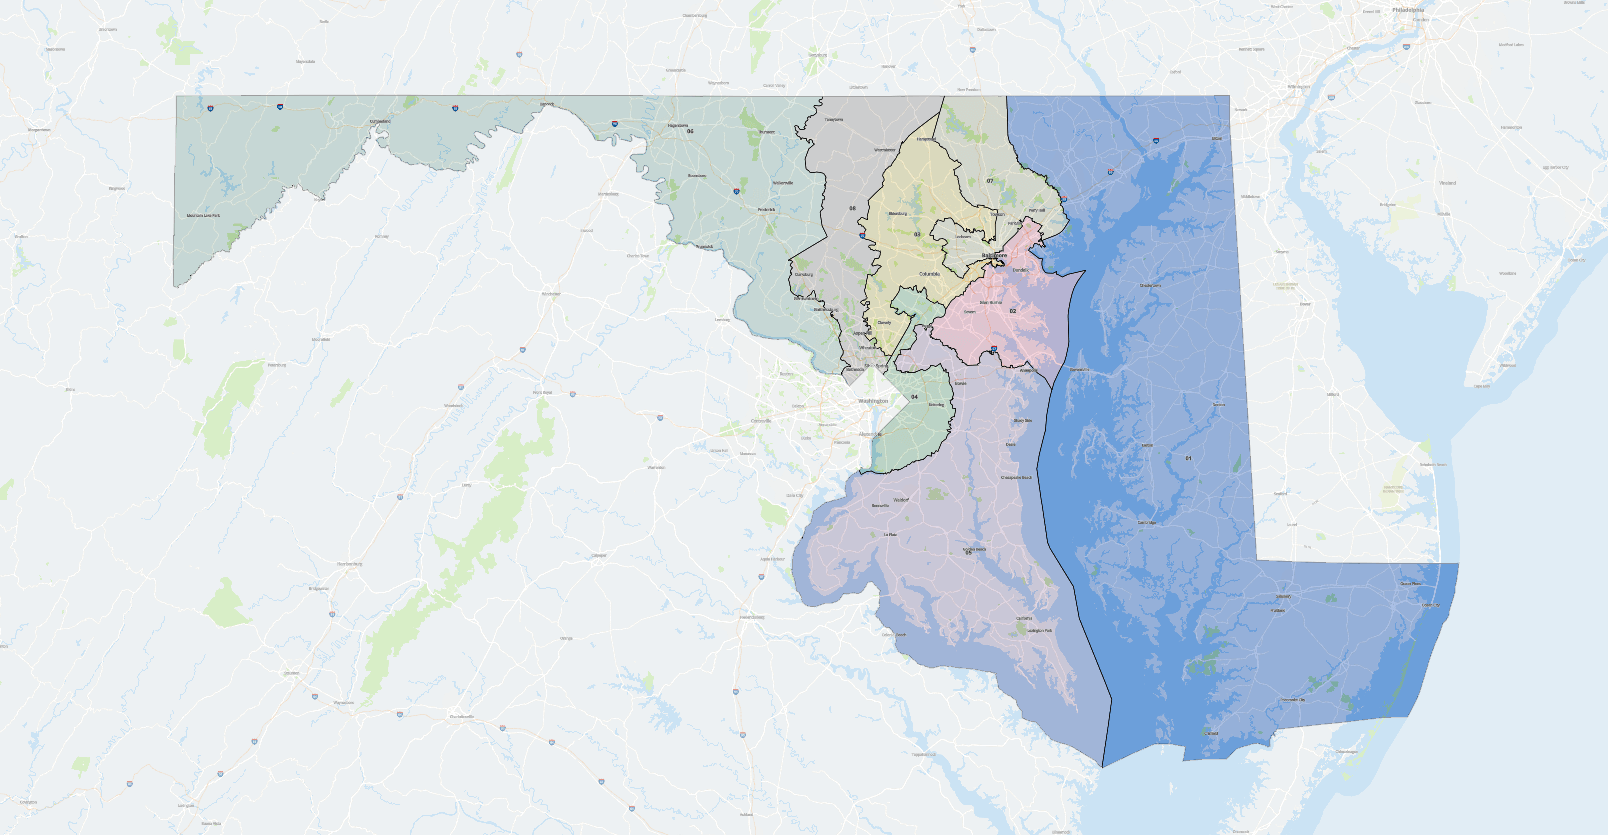
The fourth and final congressional concept map released by the Legislative Redistricting Advisory Commission on Tuesday, Nov. 9.
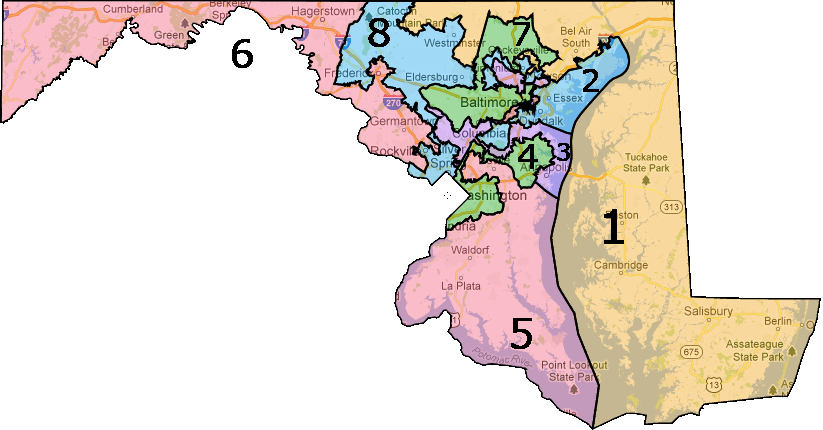
Maryland’s current congressional map.
But with Democrats in solid control of the Maryland legislature, all eyes are on the proposals the LRAC offered up late Tuesday.
The biggest question facing State House Democrats and their allies in the congressional delegation is whether to pursue a map capable of pushing the majority party’s current 7-1 advantage to 8-0.
According to one of the country’s top redistricting analysts, David Wasserman of the Cook Political Report, the LRAC stopped short of declaring all-out war on the lone Republican, Rep. Andrew P. Harris, who represents the mostly rural and solidly conservative 1st District. His district includes the Eastern Shore and portions of Baltimore, Harford and Carroll counties.
“Two [of the four proposals] would lock in the state’s current 7D-1R breakdown, while two would target Democrats’ arch-nemesis, Freedom Caucus GOP Rep. Andy Harris, for an 8D-0R shutout,” Wasserman wrote this week.
“But in a surprise, none of Democrats’ four drafts make Harris’s 1st CD as blue as they could have,” he added. “The most aggressive draft would lop off red Cecil County from the Eastern Shore and take the 1st CD across the Bay Bridge to Annapolis [along with] other blue precincts in Anne Arundel County, flipping it from Trump +20 to Biden +8 — even though it would be easy to draw it to Biden +15 or more by adding parts of Howard County (Columbia).”
Some analysts and operatives believe that while a Biden +8 district could be competitive with a moderate Democrat as the nominee, it might still be out of reach for Heather R. Mizeur, the progressive former state delegate who appears to be the frontrunner for the Democratic nomination in the 1st District.
If adopted in current their form, Plans 1 and 4 would maintain the status quo — seven districts favoring Democrats and a single Republican-heavy district, according to an analysis by the political forecasting website FiveThirtyEight. In those proposals, the 1st District would lie almost entirely east of the Bay Bridge.
Plans 2 and 3 pull parts of Anne Arundel into the 1st District. Plan 3 is the closest to an 8-0 Democratic map, with a 1st District that would favor Democrats 55%-45%, according to the analysts at Princeton. Plan 2 would favor Democrats 51%-49%.
Harris did not respond to an interview request Thursday, but in an email this week to Bethesda Beat, the six-term incumbent speculated that last Tuesday’s elections in Virginia, in which Republicans ran the table of statewide offices and appear to have flipped control of the House of Delegates, may have made Democrats leery of a big play.
The Virginia results “made it clear that the Democrat-controlled (legislative redistricting commission) may have been unwilling to risk attempting an 8-0 map,” Harris said.
For decades until the early 2000s, the 1st District pulled together portions of Southern Maryland and the Eastern Shore. Some Anne Arundel County residents testified at redistricting hearings this year that their communities should be included in an Eastern Shore district, due to mutual interests involving the Chesapeake Bay and the Bay Bridge.
Incumbents largely get their wishes
Maryland’s seven Democratic incumbents clearly had some sway over the four draft maps the legislative commission released — or, at the very least, they were given due consideration as the proposals were put together.
U.S. House Majority Leader Steny H. Hoyer (D), the dean of Maryland’s congressional delegation, has long insisted that his district, the 5th, include his home in St. Mary’s County and a significant chunk of majority-Black Prince George’s County, especially the area surrounding the University of Maryland College Park, which has been part of Hoyer’s district since he entered Congress in 1981.
All four maps produced by the legislature’s commission accommodate Hoyer’s desire, but doing so impacts the neighboring 4th District, a majority-Black district that currently includes parts of Prince George’s and Anne Arundel counties. In one of the four concepts, the 4th would contain large portions of Prince George’s and part of Montgomery County as well. If Plan 3 was adopted, a Montgomery Democrat could be enticed to run for the seat being vacated by Anthony G. Brown (D). From 1992 to 2002, the 4th District included Prince George’s along with Takoma Park and parts of Silver Spring in eastern Montgomery County.
All four maps would divide reliably blue — but shrinking — Baltimore City into three districts, the 2nd, 3rd and 7th. Rep. Kweisi Mfume (D), who is on his second tour of duty representing the 7th District following a 24-year hiatus, has made it known that he favors keeping the contours of his district, which was the first in Maryland created by the Voting Rights Act, as close to their original shape as possible, with some adjustment for population losses.
Western Maryland’s 6th District remains blue in the proposed maps, but it could become more competitive under one configuration.
In most map configurations, the 6th begins in the panhandle and follows the Potomac River south to include swaths of western Montgomery County (in some cases nearly reaching the District of Columbia border). Frederick County is generally less carved up, with the City of Frederick more neatly included in the 6th District, which was the subject of the legal battle that made it to the Supreme Court.
Two of the conceptual maps keep Fort Meade in Rep. C.A. Dutch Ruppersberger’s 2nd District — a top priority of the 10-term member who previously was the top Democrat on the House Intelligence Committee. But keeping that portion of Anne Arundel County in the 2nd District has a domino effect in other districts.
In a letter accompanying the release of the four concepts on Tuesday, Karl S. Aro, the chairman of the legislature’s commission, said commission members, who were appointed by the General Assembly’s presiding officers, wanted to shift as few residents to new districts as possible.
He also said the maps are intended to stimulate public discussion in the weeks leading up to the special session.
Hanging over the process are several as-yet unanswered questions: What other changes might be coming, and — of the four maps — have legislative leaders landed on a favorite? Could Maryland wind up with the most gerrymandered congressional map in the country? And what will the district boundaries ultimately look like after the courts have had their say?
Josh Kurtz contributed to this report.
Editor’s Note: This story was updated to correct a reference to the history of Bay crossings within the 1st Congressional District boundaries.

Bennett Leckrone
Reporter
Bennett Leckrone was a Report for America corps member at Maryland Matters through May 2022. He is a December 2019 graduate of the E.W. Scripps School of Journalism at Ohio University. Leckrone has interned at The Chronicle of Higher Education, The Columbus Dispatch, PennLive.com, The Dayton Daily News and The Troy Daily News.
Bruce DePuyt
Reporter
Bruce DePuyt is a contributor to Maryland Matters, where he was a full-time reporter until December 2022. Previously, DePuyt spent nearly three decades on local television, including 14 years as producer and host of “NewsTalk” on NewsChannel 8 in the Washington, D.C., region. He was a reporter and anchor on “News 21” in Montgomery, where he also served as producer and host of “21 This Week.” He then became a reporter and anchor at NBC affiliate WVIR in Charlottesville, Va. He appears occasionally on WTOP (103.5 FM), WAMU (88.5 FM) and MPT.
Related Articles

‘The liquor store was open during COVID, but not the reentry programs,’ an advocate notes.

Leaders highlight the GOP Senate candidate’s history of vetoing legislation on health care, housing bills during his term as governor.

U.S. Rep. David Trone (D) has spent almost $42 million of his own money so far, while Prince George’s County Executive Angela Alsobrooks (D) and former Gov. Larry Hogan (R) have raised money at a fast clip.
 Creative Commons Attribution